
Running code analysis through Sonar Cloud in Azure DevOps

Sonar Cloud is the SaaS version of SonarQube, a static code analyzer. It can inspect your code against a set of quality standards, detect bugs, security vulnerabilities,  calculate technical debt and see how your code quality evolves over time.

If you want to use it in Azure DevOps you should first install the SonarCloud extension from the marketplace: https://marketplace.visualstudio.com/items?itemName=SonarSource.sonarcloud

After the extension is installed you get 3 new build tasks:

Remark: Notice that this are not the same build tasks as should be used when using SonarQube(!)

Let’s create a build pipeline that uses these tasks:

  • First add the Prepare analysis on SonarCloud task. This task should be added to the beginning of your pipeline.  In this task you should configure the SonarCloud Service Endpoint, specify an Organization and set a Project Key and Project Name.
    • This information will be used to create a new project inside SonarCloud.
    • A last important step inside this task is to select the way analysis should be done. As we are building a .NET core application, we can set this to ‘Integrate with MSBuild’:

  • Next we should add the Run Code Analysis task. This task should be executed after our code has been build and all tests are executed.
  • At the end of the pipeline we can add the Publish Quality Gate Results step to upload the data to SonarCloud.

Our full pipeline now looks like this:

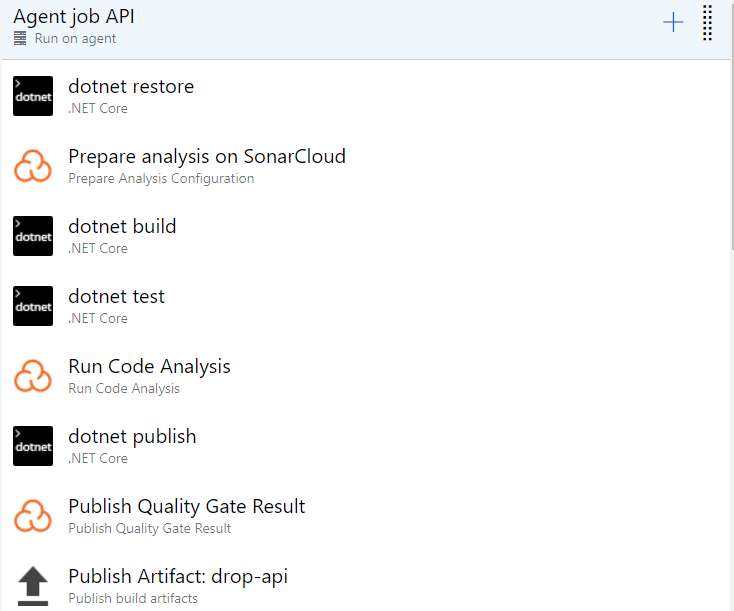
A last tip; I would recommended to not configure this on every CI build as it makes your build time a lot longer.

Popular posts from this blog

Azure DevOps/ GitHub emoji

I’m really bad at remembering emoji’s. So here is cheat sheet with all emoji’s that can be used in tools that support the github emoji markdown markup: All credits go to rcaviers who created this list.

Kubernetes–Limit your environmental impact

Reducing the carbon footprint and CO2 emission of our (cloud) workloads, is a responsibility of all of us. If you are running a Kubernetes cluster, have a look at Kube-Green . kube-green is a simple Kubernetes operator that automatically shuts down (some of) your pods when you don't need them. A single pod produces about 11 Kg CO2eq per year( here the calculation). Reason enough to give it a try! Installing kube-green in your cluster The easiest way to install the operator in your cluster is through kubectl. We first need to install a cert-manager: kubectl apply -f https://github.com/cert-manager/cert-manager/releases/download/v1.14.5/cert-manager.yaml Remark: Wait a minute before you continue as it can take some time before the cert-manager is up & running inside your cluster. Now we can install the kube-green operator: kubectl apply -f https://github.com/kube-green/kube-green/releases/latest/download/kube-green.yaml Now in the namespace where we want t...

Podman– Command execution failed with exit code 125

After updating WSL on one of the developer machines, Podman failed to work. When we took a look through Podman Desktop, we noticed that Podman had stopped running and returned the following error message: Error: Command execution failed with exit code 125 Here are the steps we tried to fix the issue: We started by running podman info to get some extra details on what could be wrong: >podman info OS: windows/amd64 provider: wsl version: 5.3.1 Cannot connect to Podman. Please verify your connection to the Linux system using `podman system connection list`, or try `podman machine init` and `podman machine start` to manage a new Linux VM Error: unable to connect to Podman socket: failed to connect: dial tcp 127.0.0.1:2655: connectex: No connection could be made because the target machine actively refused it. That makes sense as the podman VM was not running. Let’s check the VM: >podman machine list NAME         ...