Modern software development relies heavily on third-party dependencies. Whether you're building a Java application with Maven, a Javascript app with npm, a .NET application with NuGet, or a Python service with pip, you're likely incorporating dozens—if not hundreds—of external libraries into your codebase. While this approach accelerates development, it also introduces significant security and compliance risks that many organizations struggle to manage effectively.
This is the first post in a three-part series about how we evolved from OWASP Dependency Checker to Dependency-Track to gain visibility and control over our software supply chain. In this post, I'll introduce what Dependency-Track is and explain why we decided to adopt it.
What is Dependency-Track?
Dependency-Track is an open-source Component Analysis platform that helps organizations identify and reduce risk in their software supply chain. At its core, it's a continuous monitoring solution that ingests Software Bill of Materials (SBOM) files and cross-references the components against multiple sources of vulnerability intelligence.
Think of it as a central hub that answers critical questions like:
- What third-party components are we using across all our projects?
- Which of those components have known vulnerabilities?
- How severe are those vulnerabilities, and are we actively exploiting the vulnerable functionality?
- Are we compliant with our licensing policies?
- Which projects are affected when a new vulnerability is disclosed?
Dependency-Track supports CycloneDX as SBOM format and integrates with vulnerability databases like the National Vulnerability Database (NVD), GitHub Advisories, OSS Index, and VulnDB.
The problem we were facing
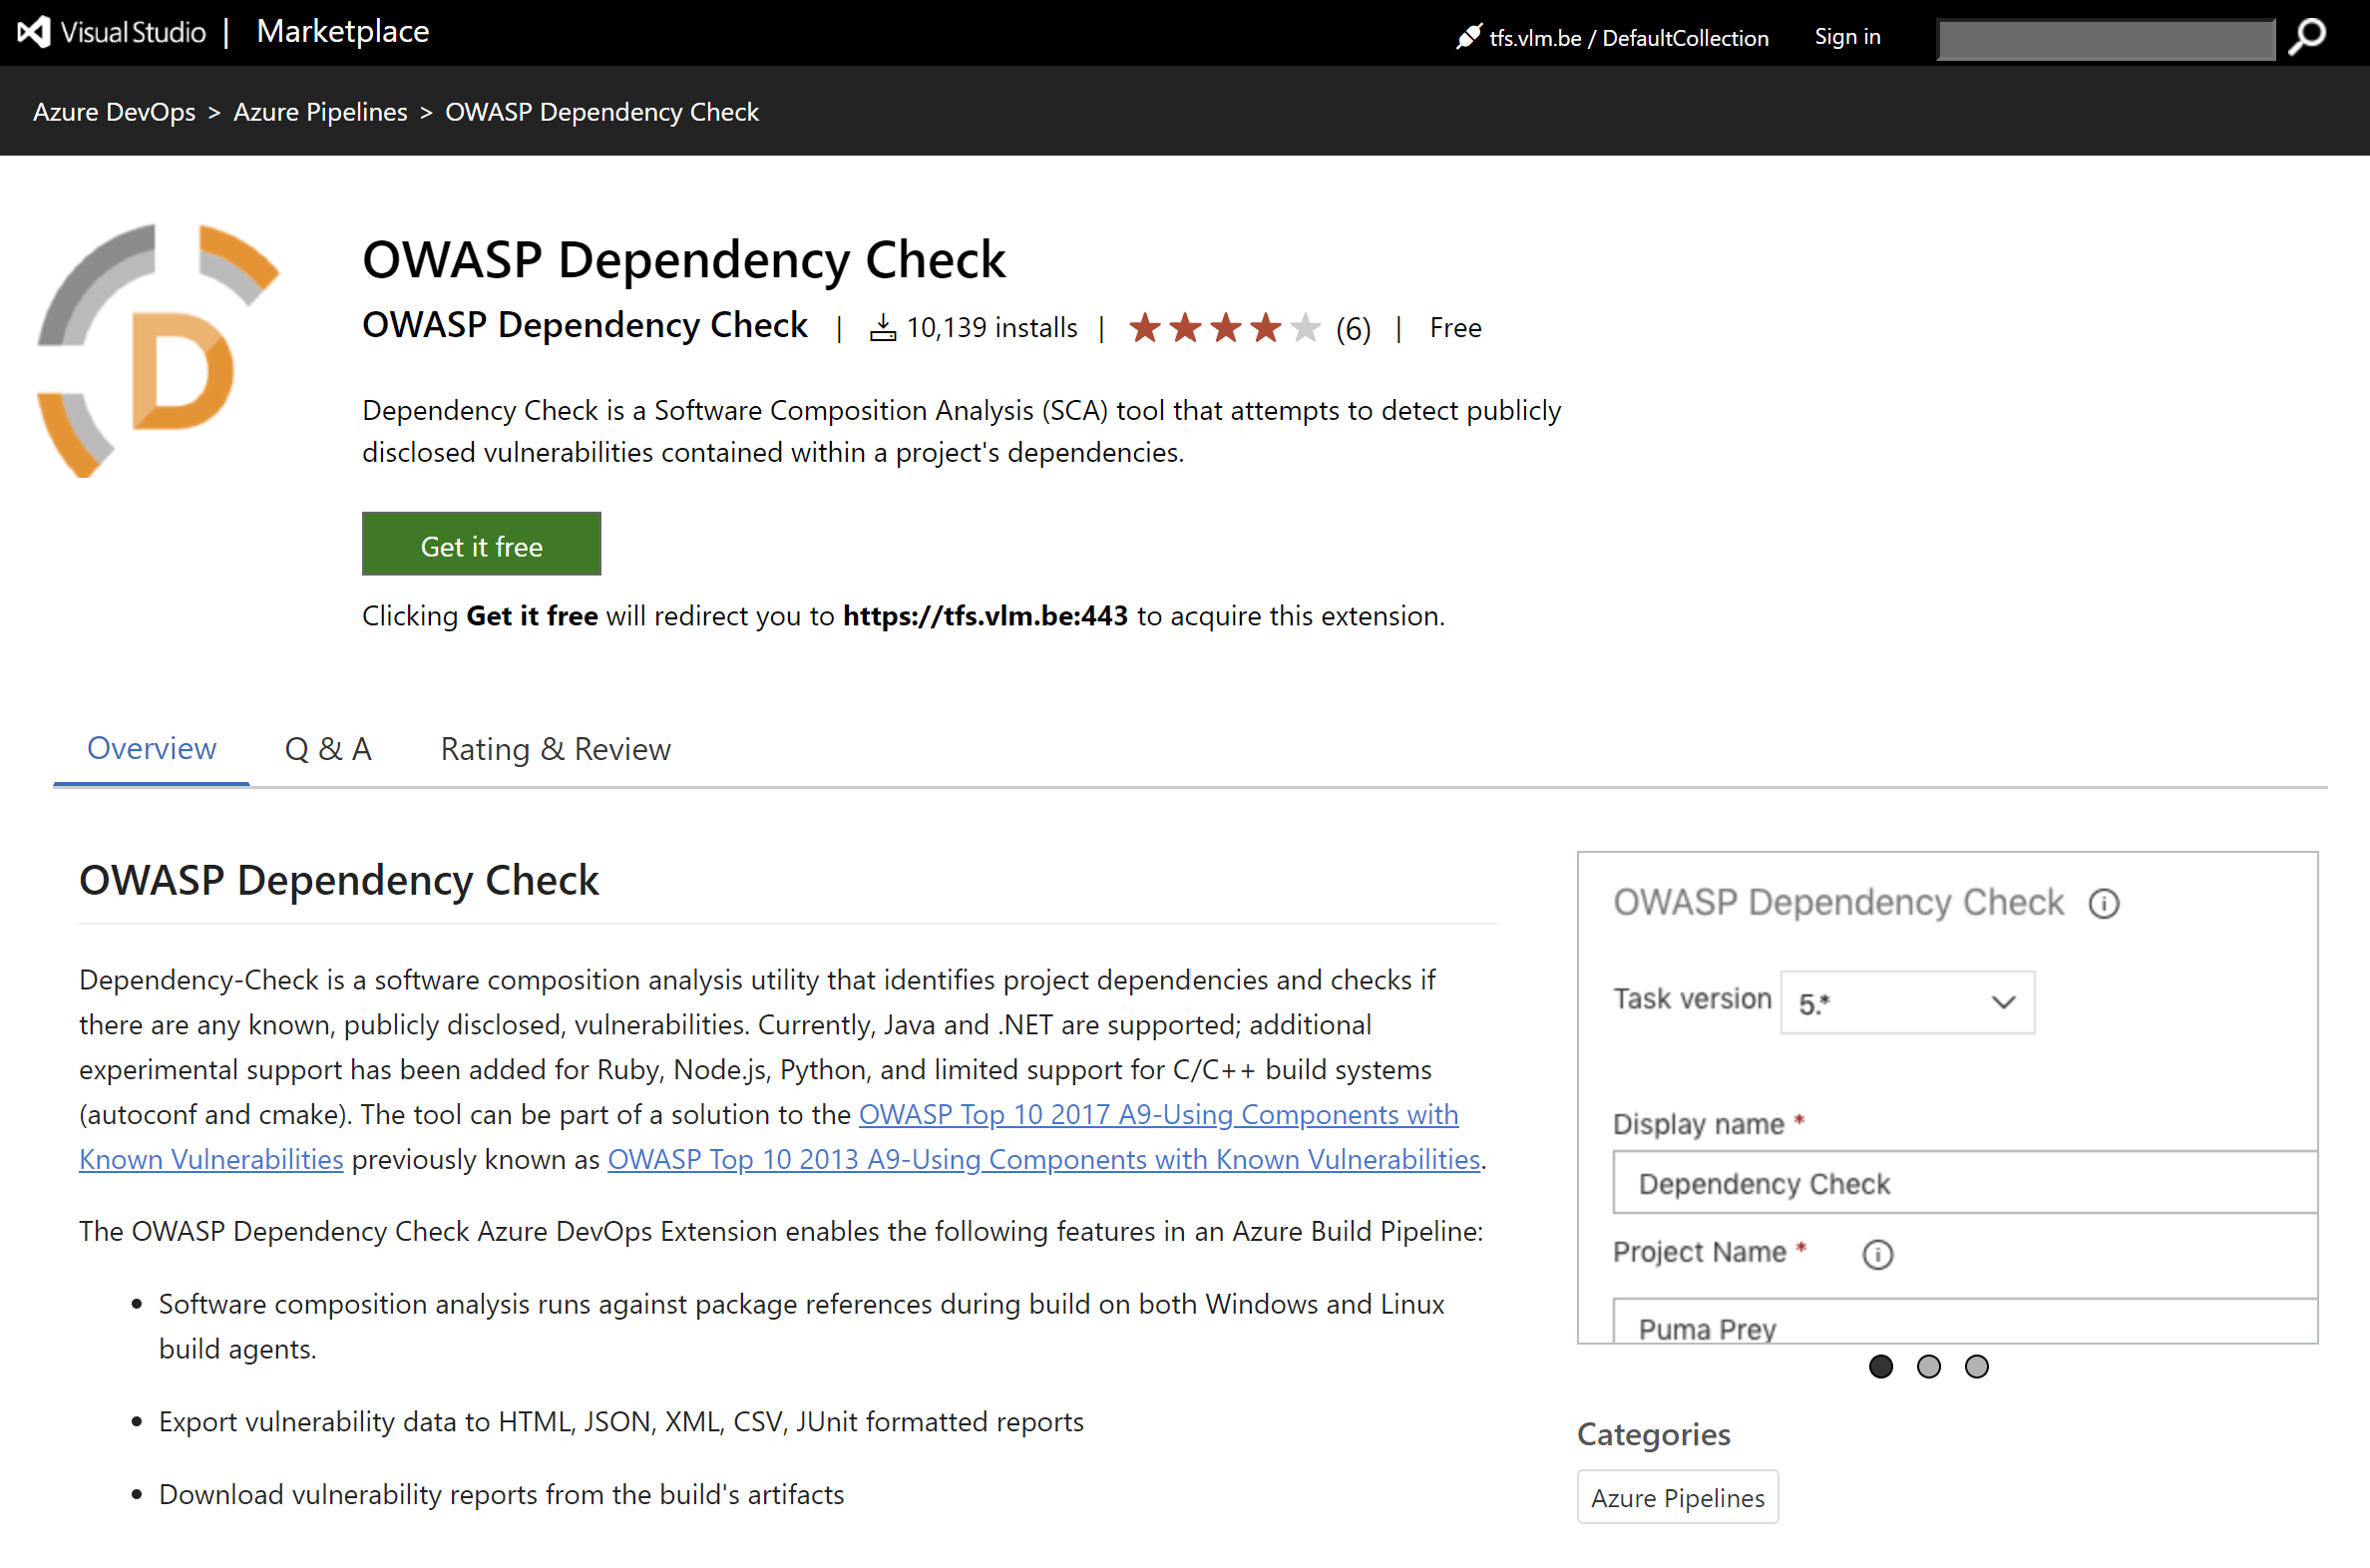
Before adopting Dependency-Track, we used OWASP Dependency Checker to manage our dependencies and monitor for vulnerabilities.
We ran the tool as part of our build pipeline and although we found it a good starting point, we faced the following changes:
Limited visibility
We had no centralized view of what dependencies were being used across our portfolio of applications. Each team had their own list of vulnerabilities stored among the build artifacts, making it impossible to answer basic questions like "Which of our services use Log4j?" when Log4Shell was disclosed.
Reactive security posture
We typically learned about vulnerabilities in our dependencies through one of two ways: security scanners in our CI/CD pipeline flagging issues at build time, or worse, through public disclosure of a major vulnerability. Both approaches meant we were always reacting rather than proactively managing risk. For projects where no active development was done, the dependencies were not scanned.
Build time impact
OWASP Dependency Checker combines both the inventarisation of the dependencies and evaluation against the National Vulnerability Database. Especially the evaluation step can take a lot of time impacting our build times. We noticed that some teams started to isolate the dependency check in a separate pipeline running it only occasionally or manually triggered defying the purpose of the whole setup.
Compliance challenges
We had no systematic way to track licensing information for our dependencies or enforce policies around acceptable licenses. This created potential legal and compliance risks, especially as we moved toward commercial distribution of some products.
Why Dependency-Track?
After evaluating several solutions, we chose Dependency-Track for several compelling reasons:
Open source and self-hosted
As an open-source solution that we can self-host, Dependency-Track gives us complete control over our data. We don't need to send our SBOMs to external services, which is crucial for our security and compliance requirements. The active community and transparent development process also gave us confidence in the platform's longevity.
Standards-based approach
Dependency-Track's embrace of industry standards like CycloneDX means we're not locked into proprietary formats. We can generate SBOMs using a variety of tools and feed them into Dependency-Track, giving us flexibility in our toolchain.
Remark: There are at the moment 2 standard SBOM formats; CycloneDX and SPDX. SPDX support is very limited right now(only for licenses) in OWASP Dependency Track but external tools are available that allow you to convert between both formats.
Comprehensive vulnerability intelligence
The platform aggregates data from multiple vulnerability sources, providing a more complete picture than relying on a single database. It also supports vulnerability aliases, helping us understand when the same vulnerability is tracked under different identifiers across databases.
Policy engine
Dependency-Track includes a flexible policy engine that allows us to define organizational rules around security, licensing, and operational concerns. We can automatically flag violations and even fail builds based on policy breaches, ensuring consistent enforcement across all projects.
API-first design
Everything in Dependency-Track can be automated through its REST API. This makes it easy to integrate with our existing CI/CD pipelines, ticketing systems, and notification channels. We can programmatically upload SBOMs, retrieve vulnerability data, and query project metrics.
Portfolio management
The ability to organize projects into hierarchical structures and tags allows us to mirror our organizational structure. We can track vulnerabilities at the team level, product level, or across the entire organization, making it easier to assign ownership and track remediation.
Continuous monitoring
Unlike scan-on-commit tools that only check dependencies at build time, Dependency-Track continuously monitors our deployed applications. When a new vulnerability is disclosed, we're immediately notified about which projects are affected, even if they haven't been rebuilt recently.
What's next
In the next post in this series, I'll walk through how we set up Dependency-Track in our Azure environment, including deployment architecture, configuration decisions, and security integration.
In the final post, we'll dive into the technical details of integrating Dependency-Track into our CI/CD pipelines, showing you exactly how we generate and upload SBOMs automatically as part of our build process.
If you're struggling with any of the challenges I've described, I encourage you to give Dependency-Track a look. The project is actively maintained, well-documented, and has a helpful community.
You can find more information at https://dependencytrack.org.
More information
Introduction | Dependency-Track
Gain insights in your software supply chain using GitHub’s Dependency Graph
Understanding Supply-Chain Attacks and OWASP Dependency Check
OWASP Dependency Check - Improve update speed
Using OWASP Dependency Check in Azure DevOps for .NET applications
Using OWASP Dependency Check in Azure DevOps for Angular applications


