If you ever used Github, you’ve certainly seen the contribution graph. This graph shows the contribution of a user in one or more repo's over time:
This feature is not available out of the box in Azure DevOps (Server) but thanks to the Contribution Graph plugin from Otto Streifel, you can add this feature there as well.
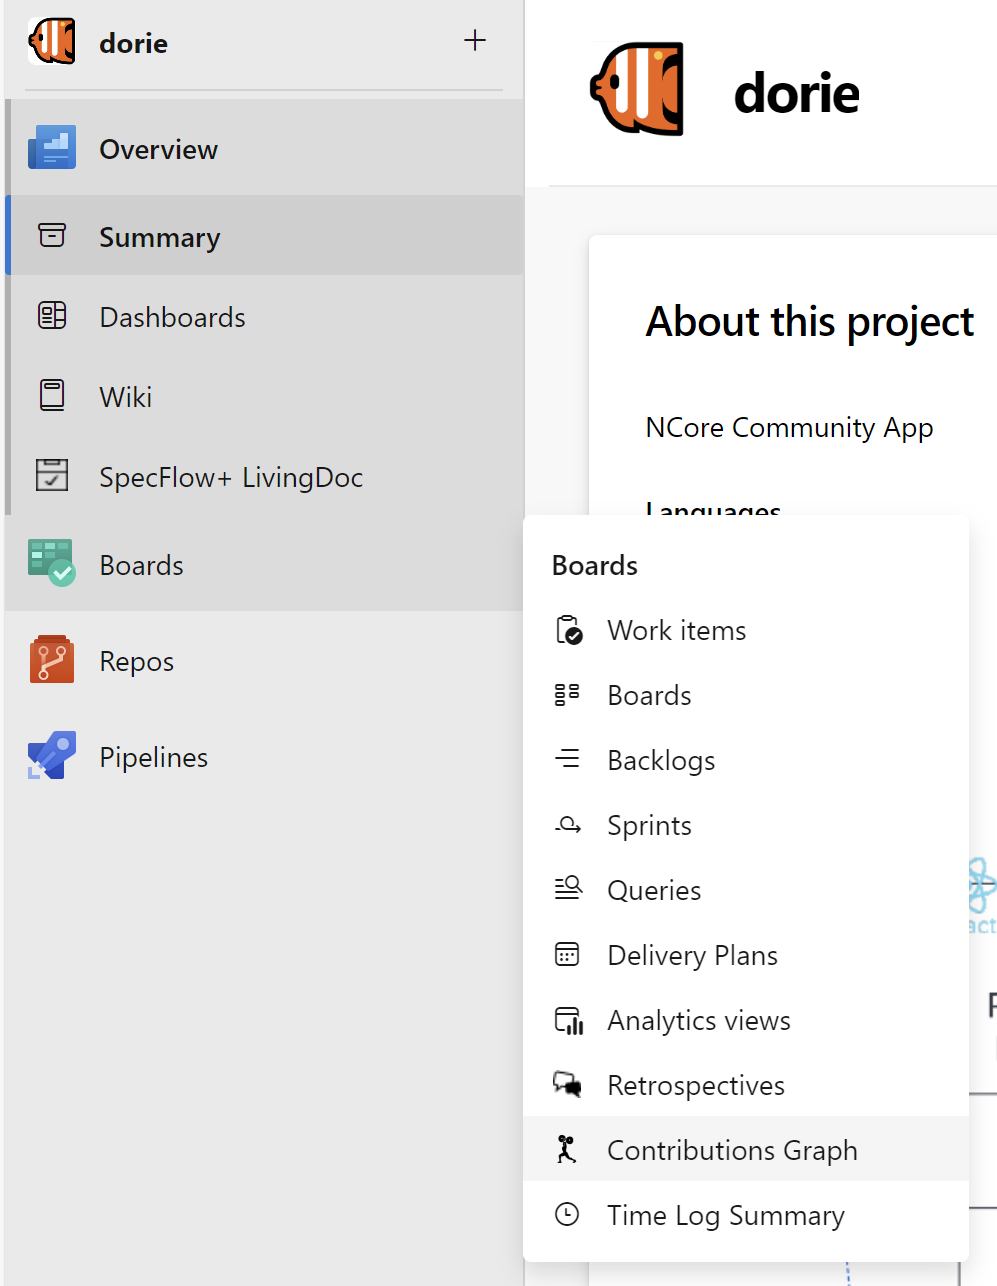
After installing this extension, you can find it under Boards > Contribution Graph:
When you open the graph you see the contributions you made over time(similar to the Github experience):
You can filter the visible information by expanding the Activity filters:
It is possible to select multiple users and repositories and filter the type of activities you want to visualize.
Nice!


