I’m building a data pipeline using TPL Dataflow to migrate data from a database to an external API. As this data pipeline could run for a long time, I was looking for a good way to monitor the progress. This turned out to be a perfect use case for Event Counters.
Yesterday I introduced EventCounters and showed a small example. Today let’s have a look on how we can monitor the EventCounters values.
Monitor EventCounters using dotnet-counters
There are multiple ways to read out EventCounters values but the way I want to use during the migration is through the dotnet-counters global tool:
dotnet-counters is a performance monitoring tool for ad-hoc health monitoring and first-level performance investigation. It can observe performance counter values that are published via the EventCounter API or the Meter API. For example, you can quickly monitor things like the CPU usage or the rate of exceptions being thrown in your .NET Core application to see if there's anything suspicious before diving into more serious performance investigation using PerfView or dotnet-trace.
If you don’t have the tool installed yet, you can install the latest version using dotnet install:
dotnet tool install --global dotnet-counters
Now that we have the dotnet-counters tool available, we can use dotnet-counters ps to display a list of .NET processes that can be monitored:

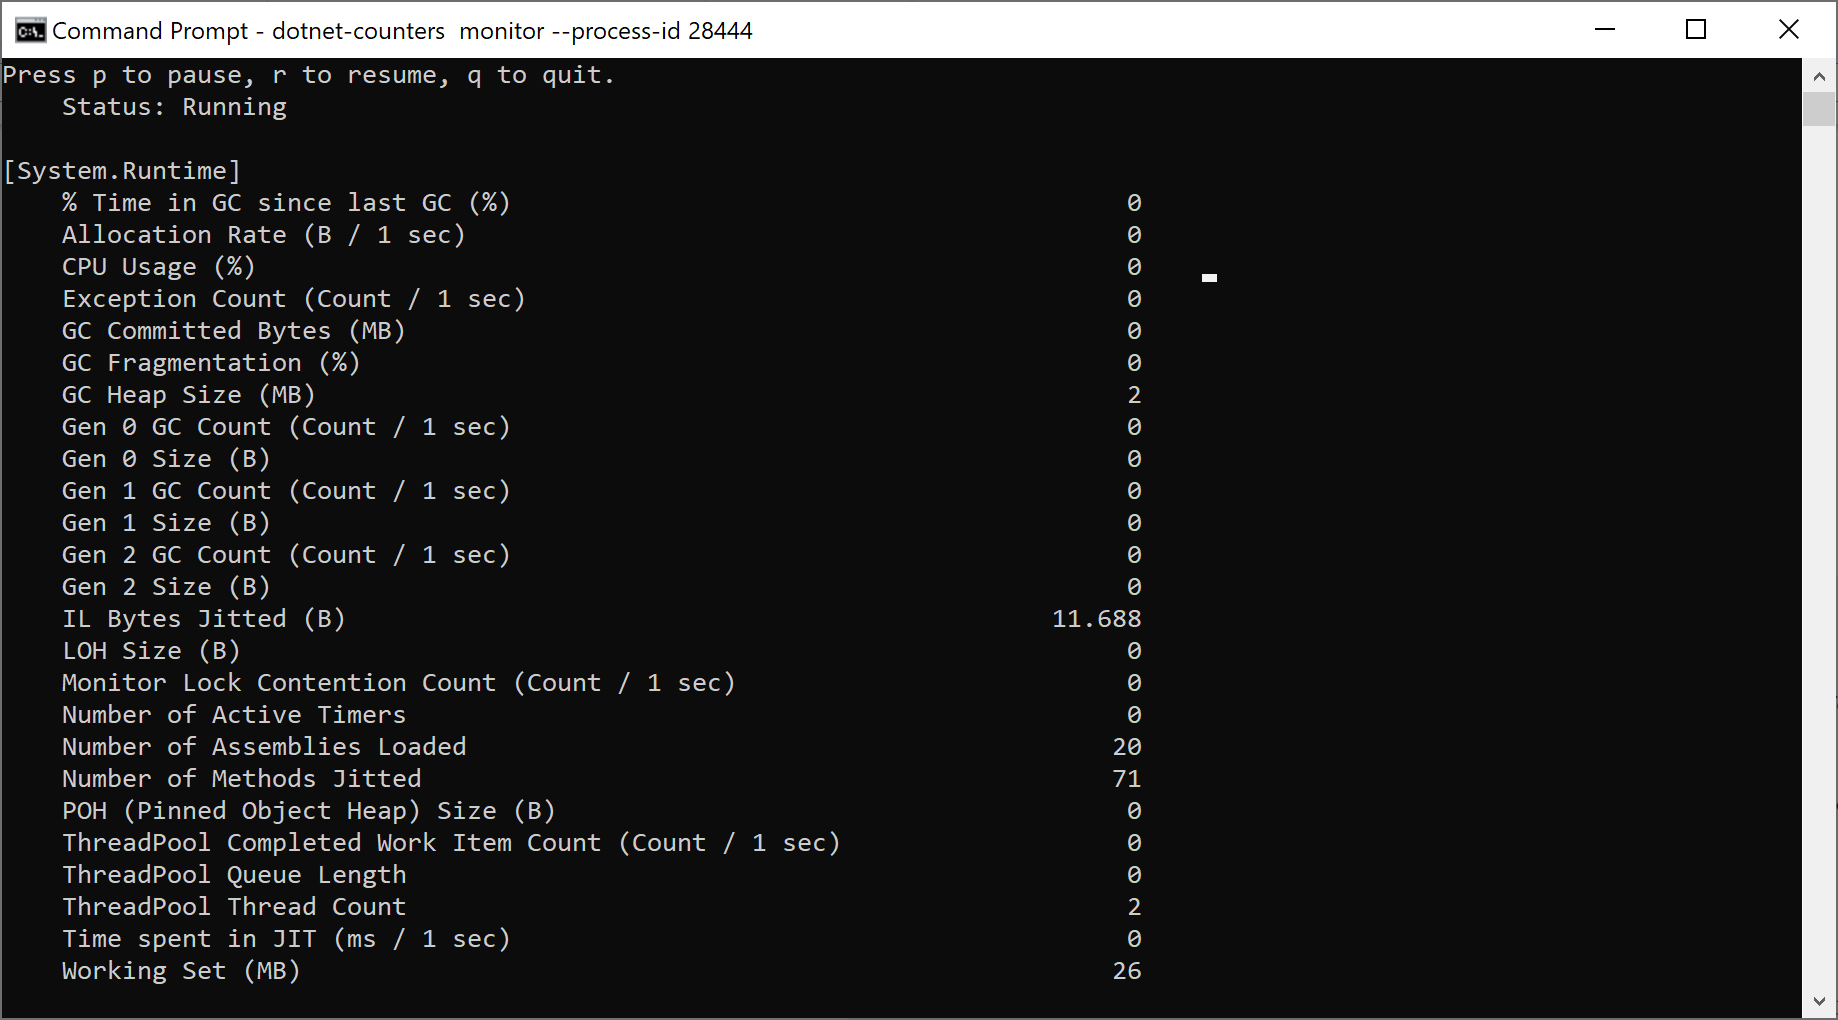
Now we can invoke the dotnet-counters monitor command and pass the process id as a parameter:
dotnet-counters monitor --process-id 28444
This will start the monitoring. By default we get a list of eventcounters from System.Runtime:
To view the EventCounter we created in the previous post, we should specify the counter name:
dotnet-counters monitor --process-id 28444 – --counters Migrator.MigratedRecordsCounter
Now we should see the values from our counter:

Nice!
In the next post, we'll have a look at some of the other counters and see how we can further improve our example. Stay tuned!