
Cloudbrew 2022–Advanced telemetry with Azure Monitor Application Insights

This weekend I had the honor to speak at CloudBrew, a 2 day conference organized by AZUG, the Belgium Microsoft Azure User Group.

I really enjoyed the conference; great sessions, nice location, good food. I had the time to chat up with some other community members.

Advanced telemetry with Azure Monitor Application Insights

I did a session about Application Insights:

You've added the Application Insights NuGet or NPM package to your application, but now what? This demo-driven session will show you how to get the maximum out of Application Insights and achieve true insights in your application behavior and performance. Profiling, dependency tracking, snapshots, extensibility, availability,... no feature remains untouched.

In case you are looking for my slides, they can be found here: https://github.com/wullemsb/presentations/tree/main/CloudBrew%20-%202022

During my presentation I used 2 demo applications. They are both an adaption of the eShopOnWeb reference application.

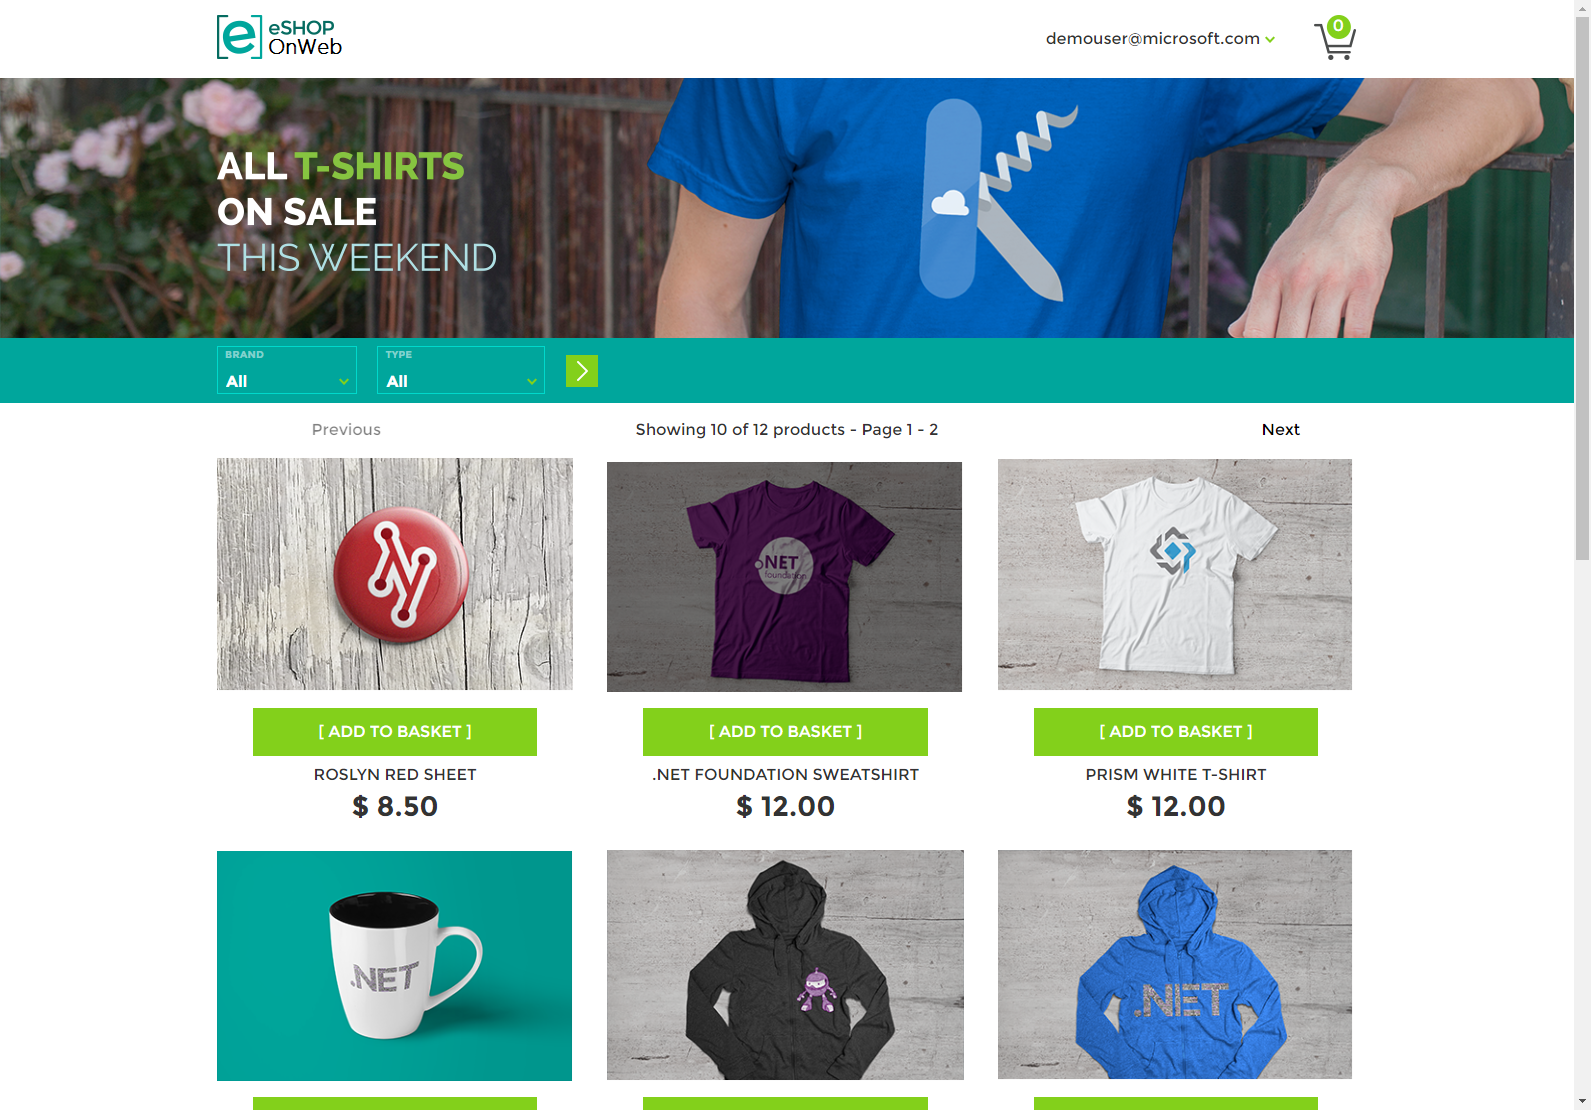
One application shows how to implement the Application Insights SDK in an ASP.Net Core Razor Pages and Blazor application:

https://github.com/wullemsb/presentations/tree/main/CloudBrew%20-%202022/eShopOnWeb%20-%20AppInsights

The other application shows how to implement OpenTelemetry in your ASP.NET Core application and send this telemetry data to Application insights:

 https://github.com/wullemsb/presentations/tree/main/CloudBrew%20-%202022/eShopOnWeb%20-%20OpenTelemetry

I’ve written a list of related blog posts(and more will come). Check them all out here: https://bartwullems.blogspot.com/search?q=application+insights

Popular posts from this blog

Podman– Command execution failed with exit code 125

After updating WSL on one of the developer machines, Podman failed to work. When we took a look through Podman Desktop, we noticed that Podman had stopped running and returned the following error message: Error: Command execution failed with exit code 125 Here are the steps we tried to fix the issue: We started by running podman info to get some extra details on what could be wrong: >podman info OS: windows/amd64 provider: wsl version: 5.3.1 Cannot connect to Podman. Please verify your connection to the Linux system using `podman system connection list`, or try `podman machine init` and `podman machine start` to manage a new Linux VM Error: unable to connect to Podman socket: failed to connect: dial tcp 127.0.0.1:2655: connectex: No connection could be made because the target machine actively refused it. That makes sense as the podman VM was not running. Let’s check the VM: >podman machine list NAME         ...

Azure DevOps/ GitHub emoji

I’m really bad at remembering emoji’s. So here is cheat sheet with all emoji’s that can be used in tools that support the github emoji markdown markup: All credits go to rcaviers who created this list.

VS Code Planning mode

After the introduction of Plan mode in Visual Studio , it now also found its way into VS Code. Planning mode, or as I like to call it 'Hannibal mode', extends GitHub Copilot's Agent Mode capabilities to handle larger, multi-step coding tasks with a structured approach. Instead of jumping straight into code generation, Planning mode creates a detailed execution plan. If you want more details, have a look at my previous post . Putting plan mode into action VS Code takes a different approach compared to Visual Studio when using plan mode. Instead of a configuration setting that you can activate but have limited control over, planning is available as a separate chat mode/agent: I like this approach better than how Visual Studio does it as you have explicit control when plan mode is activated. Instead of immediately diving into execution, the plan agent creates a plan and asks some follow up questions: You can further edit the plan by clicking on ‘Open in Editor’: ...