
Azure Pipelines–Parallel stages

I’m currently migrating an existing CI/CD pipeline build in Azure DevOps from the ‘classic’ build approach to YAML templates.

One of the things I had to do was find out a way to run multiple stages in parallel. In the original pipeline code was deployed to multiple environments at the same time and I needed something similar when using YAML templates.

By default when you define multiple stages in a pipeline, they run sequentially in the order in which you define them in the YAML file. The exception to this is when you add dependencies. With dependencies, stages run in the order of the dependsOn requirements.

We can use this to our advantage to run 2 stages in parallel. Here is the yaml file we used:

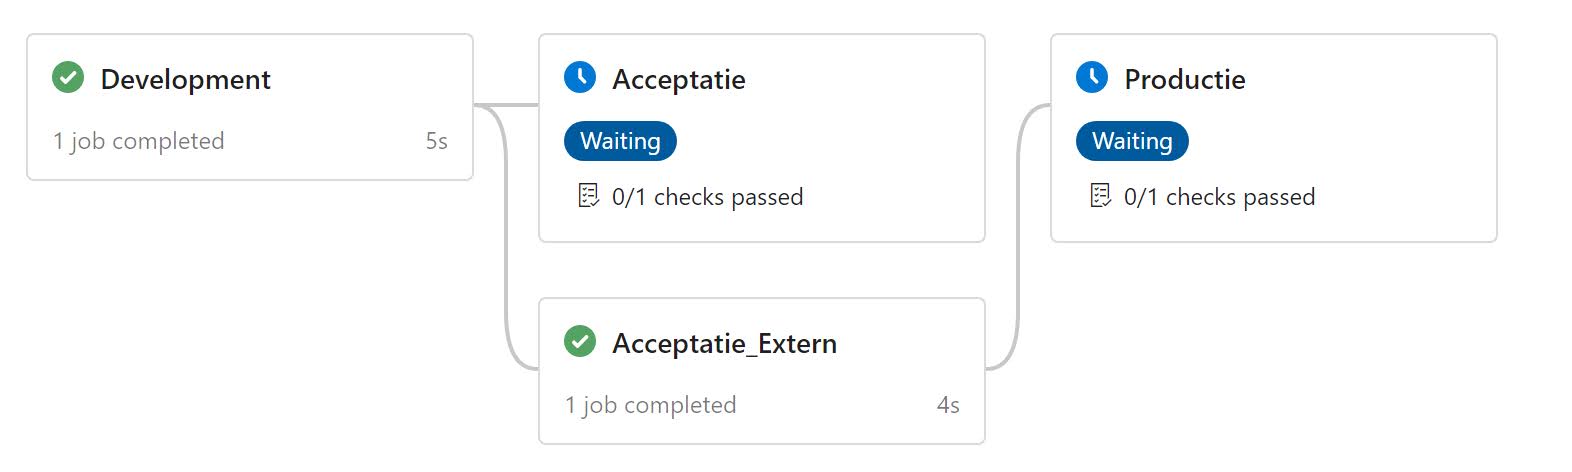
Notice the dependsOn we use in the ‘Acceptatie_Extern’ stage. This will trigger both the ‘Acceptatie’ and ‘Acceptatie_Extern’ stage after the ‘Development’ stage.

And here is how the final pipeline looked like:
Popular posts from this blog

Podman– Command execution failed with exit code 125

After updating WSL on one of the developer machines, Podman failed to work. When we took a look through Podman Desktop, we noticed that Podman had stopped running and returned the following error message: Error: Command execution failed with exit code 125 Here are the steps we tried to fix the issue: We started by running podman info to get some extra details on what could be wrong: >podman info OS: windows/amd64 provider: wsl version: 5.3.1 Cannot connect to Podman. Please verify your connection to the Linux system using `podman system connection list`, or try `podman machine init` and `podman machine start` to manage a new Linux VM Error: unable to connect to Podman socket: failed to connect: dial tcp 127.0.0.1:2655: connectex: No connection could be made because the target machine actively refused it. That makes sense as the podman VM was not running. Let’s check the VM: >podman machine list NAME         ...

Cache stampede: when our cache turned against us

While investigating some performance issues, we ran into an ASP.NET Core API that cached a fairly expensive aggregation query for 60 seconds. Under normal load, that was fine: one request rebuilds the cache, everyone else reads from it. Under peak load, dozens of requests would arrive in that same expiry window, all see a cache miss, and all fire the same expensive query in parallel. The database didn't like that. That was the moment when our caching layer stopped helping and started hurting. A burst of requests comes in at the same time, all miss the cache, and all go hammer the database or the downstream API at once. That's a cache stampede . The cache was supposed to protect our backend, and for a few hundred milliseconds it did the opposite. Why this happens IMemoryCache.GetOrCreate (and its async sibling) looks like it protects you, but it doesn't add any locking on its own. Look at the naive version: public async Task<Report> GetReportAsync(string key) ...

VS Code Planning mode

After the introduction of Plan mode in Visual Studio , it now also found its way into VS Code. Planning mode, or as I like to call it 'Hannibal mode', extends GitHub Copilot's Agent Mode capabilities to handle larger, multi-step coding tasks with a structured approach. Instead of jumping straight into code generation, Planning mode creates a detailed execution plan. If you want more details, have a look at my previous post . Putting plan mode into action VS Code takes a different approach compared to Visual Studio when using plan mode. Instead of a configuration setting that you can activate but have limited control over, planning is available as a separate chat mode/agent: I like this approach better than how Visual Studio does it as you have explicit control when plan mode is activated. Instead of immediately diving into execution, the plan agent creates a plan and asks some follow up questions: You can further edit the plan by clicking on ‘Open in Editor’: ...