
Azure Static Web App–Traffic splitting

As a follow-up on the presentation I did at CloudBrew about Azure Static Web Apps I want to write a series of blog posts.

Yesterday I talked about limiting access to your staging environment by password protecting it. This allows you to work with a limited set of test users who can access the staging environment(assuming they got the visitor password).

However sometimes you want to do something like a canary deployment where we redirect a small subset of your users in production to a new version of your application.

This is something that is also possible in Azure Static Web Apps through the concept of Traffic splitting. To activate this feature go to your Azure static web app resource in the Azure portal:

  • Go to Environments.


  • Choose Traffic splitting at the top. This will open the Traffic splitting pane.

  • There we can add an extra environment by clicking Add. We need to select an environment and specify the amount of traffic that should be redirected to this environment.

  • Click Save to commit your changes.

Now a part of our users will go to the Production environment where some will end up on our PR environment.

Remark: To avoid strange behavior returning traffic will always go to the same environment.

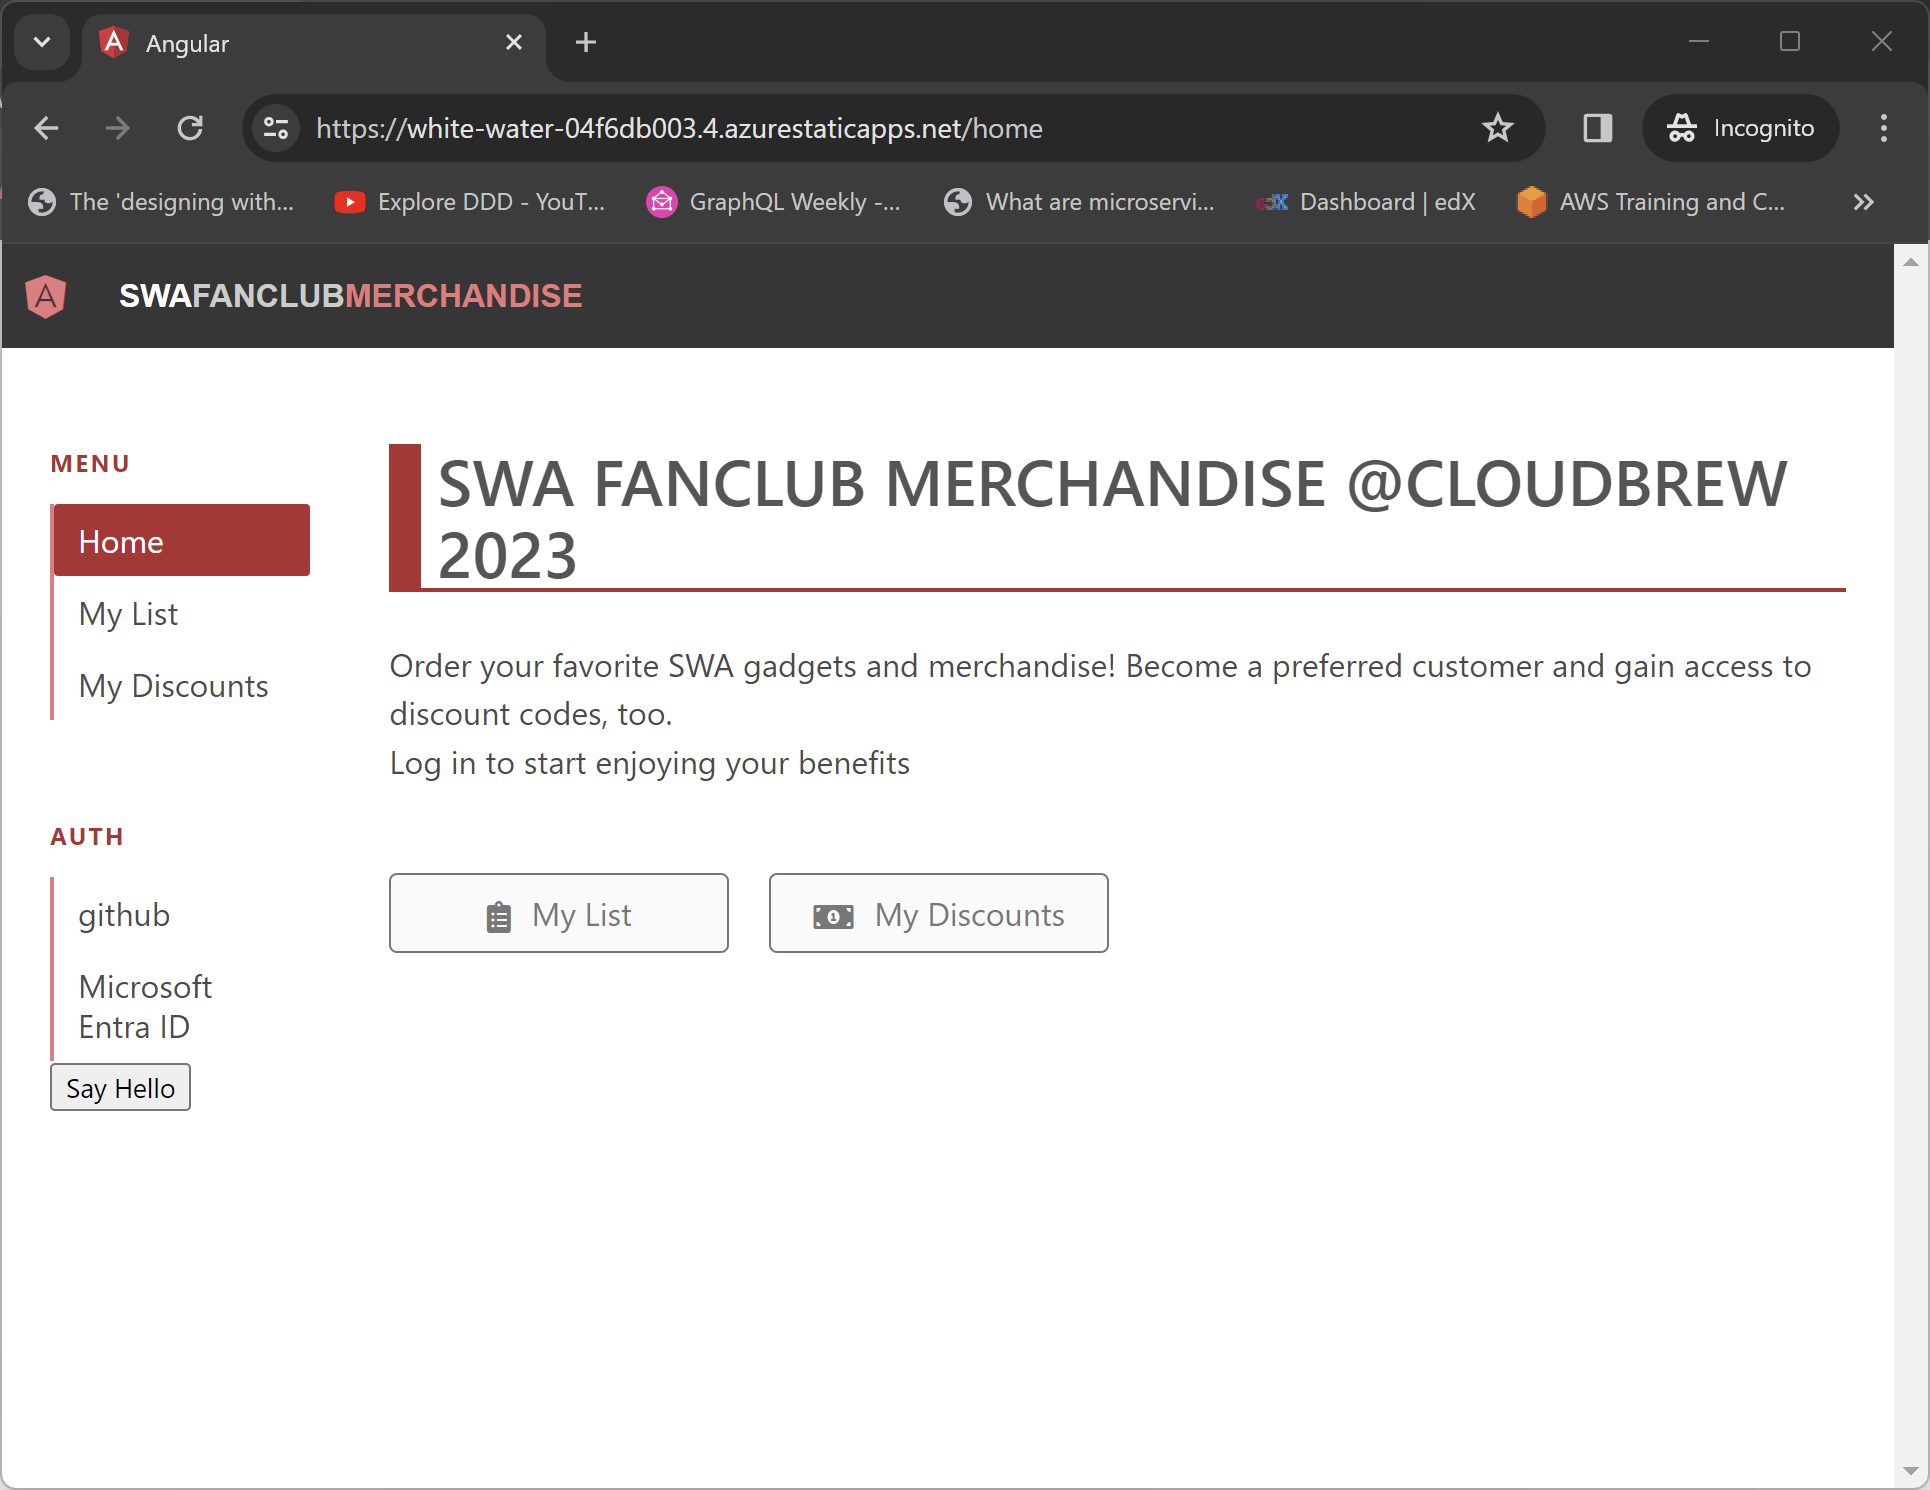
If I now open 2 browser windows and browse to the production URL, we get two different pages(notice the difference in the title):


I wondered what would happen if I tried to combine this feature with the password protection I showed yesterday…

When I selected the Protect both staging and production environment option, I got the password request. When I  selected the Protect staging environments only option, I got to see the PR environment. This makes sense I think as a part of our production traffic is redirect behind the scenes.  I still cannot directly access the PR environment without providing the password.

More information

Traffic Splitting in Azure Static Web Apps (preview) | Microsoft Learn

Popular posts from this blog

Azure DevOps/ GitHub emoji

I’m really bad at remembering emoji’s. So here is cheat sheet with all emoji’s that can be used in tools that support the github emoji markdown markup: All credits go to rcaviers who created this list.

Kubernetes–Limit your environmental impact

Reducing the carbon footprint and CO2 emission of our (cloud) workloads, is a responsibility of all of us. If you are running a Kubernetes cluster, have a look at Kube-Green . kube-green is a simple Kubernetes operator that automatically shuts down (some of) your pods when you don't need them. A single pod produces about 11 Kg CO2eq per year( here the calculation). Reason enough to give it a try! Installing kube-green in your cluster The easiest way to install the operator in your cluster is through kubectl. We first need to install a cert-manager: kubectl apply -f https://github.com/cert-manager/cert-manager/releases/download/v1.14.5/cert-manager.yaml Remark: Wait a minute before you continue as it can take some time before the cert-manager is up & running inside your cluster. Now we can install the kube-green operator: kubectl apply -f https://github.com/kube-green/kube-green/releases/latest/download/kube-green.yaml Now in the namespace where we want t...

Podman– Command execution failed with exit code 125

After updating WSL on one of the developer machines, Podman failed to work. When we took a look through Podman Desktop, we noticed that Podman had stopped running and returned the following error message: Error: Command execution failed with exit code 125 Here are the steps we tried to fix the issue: We started by running podman info to get some extra details on what could be wrong: >podman info OS: windows/amd64 provider: wsl version: 5.3.1 Cannot connect to Podman. Please verify your connection to the Linux system using `podman system connection list`, or try `podman machine init` and `podman machine start` to manage a new Linux VM Error: unable to connect to Podman socket: failed to connect: dial tcp 127.0.0.1:2655: connectex: No connection could be made because the target machine actively refused it. That makes sense as the podman VM was not running. Let’s check the VM: >podman machine list NAME         ...