One of the features you get out-of-the-box when using Application Insights is the ability to collect performance counter data. This allows you to track statistics like CPU, memory and disk usage.
In ASP.NET Core the following counters are collected by default:
- % Process\Processor Time
- % Process\Processor Time Normalized
- Memory\Available Bytes
- Process\Private Bytes
- Process\IO Data Bytes/sec
- Processor(_Total)\% Processor Time
When the performance counters are collected correctly, you can use them as one of the available metrics in Application Insights:

Troubleshooting performance counters collection
But what if no data is returned?
First thing you should check, if you have a related log message. Therefore run the following KQL query inside the Logs section:
traces
| where message startswith "AI: Error collecting"
| limit 10
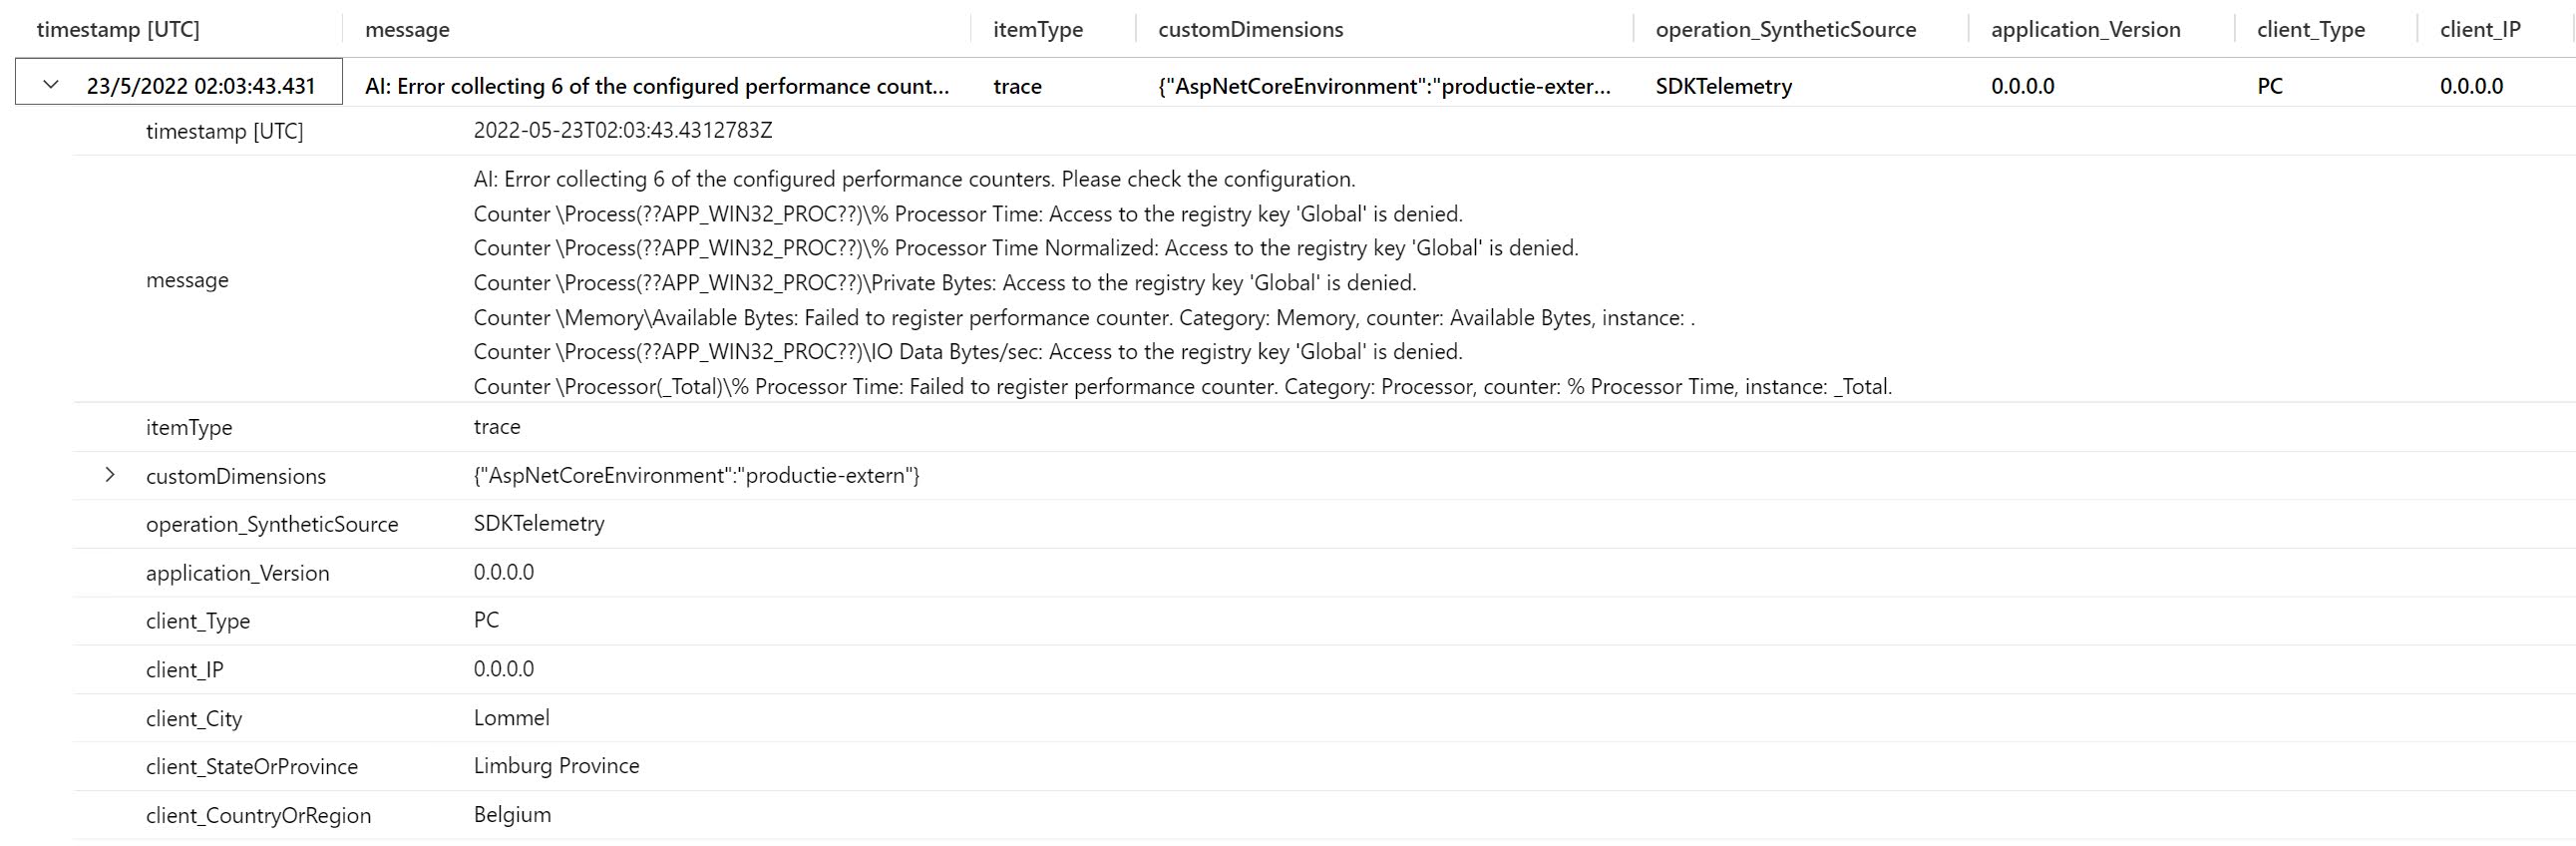
In my case it returned the following error message:
AI: Error collecting 6 of the configured performance counters. Please check the configuration.
Counter \Process(??APP_WIN32_PROC??)\% Processor Time: Access to the registry key 'Global' is denied.
Counter \Process(??APP_WIN32_PROC??)\% Processor Time Normalized: Access to the registry key 'Global' is denied.
Counter \Process(??APP_WIN32_PROC??)\Private Bytes: Access to the registry key 'Global' is denied.
Counter \Memory\Available Bytes: Failed to register performance counter. Category: Memory, counter: Available Bytes, instance: .
Counter \Process(??APP_WIN32_PROC??)\IO Data Bytes/sec: Access to the registry key 'Global' is denied.
Counter \Processor(_Total)\% Processor Time: Failed to register performance counter. Category: Processor, counter: % Processor Time, instance: _Total.
This error message rang a bel and a search on my blog returned the following post from 2019:
https://bartwullems.blogspot.com/2019/09/access-to-registry-key-global-is-denied.html
To solve the issue, we have to add the Application Pool user(use the following name: IIS AppPool\<applicationpool name>) to both the Performance Monitor users and Performance Log Users group. After doing that, the error should disappear.
Remark: Don’t forget to restart the application pool after adding the user