When using a container orchestrator like Kubernetes it is recommended to add health check probes to your application. These health probes can be used to check the app’s status and help the container orchestrator decide when to restart a container, start sending traffic, …
So we decided to use the Microsoft.AspNetCore.Diagnostics.HealthChecks package to add a healthcheck endpoint to our ASP.NET Core applications:
Inside the health check, we test our app dependencies to confirm availability and normal functioning. So far, so good…
Unfortunately we went a little bit too far with this approach which got us into trouble. What did we do wrong?
Therefore I need to explain a little bit about our architecture. We use an API gateway as the single entry point for all of our services:
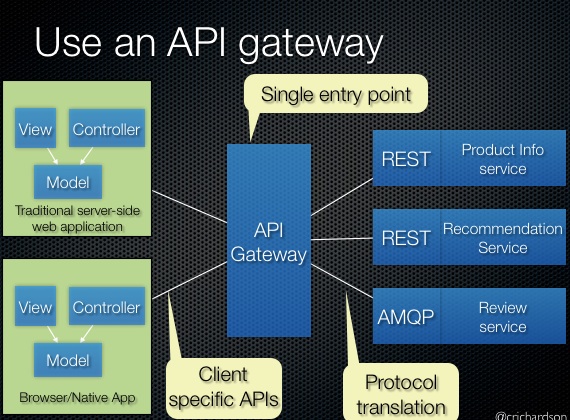
This API gateway is just another ASP.NET Core Application that is using GraphQL schema stitching to bring all our API’s together in one logical schema. And of course we also added a healthcheck endpoint here:
Inside this health check, we check the availability of all the other services. And that is were we got ourselves into trouble. Because now, even when one less important service becomes unavailable, the whole API gateway is marked as unhealthy and becomes unavailable. So instead of making our system more resilient, introducing health checks made our system less resilient. Whoops!
Dumb and smart health checks
The solution is to first of all distinguish between dumb and smart health checks:
- Smart probes check that an application is working correctly, that it can service requests, and that it can connect to its dependencies (a database, message queue, or other API, for example).
- Dumb probes check only indicate the application has not crashed. They don't check that the application can connect to its dependencies.
Also think about what dependencies are necessary for a service to be available. Does a service is no longer usable when your logging infrastructure is temporary unavailable? In our case this would avoided our mistake to include all our services in the API gateway health check.
When you are using Kubernetes as your container orchestrator, a third tip could be added to the list. Kubernetes doesn’t have one healthcheck probe but has 3, which are used for different purposes:
- Liveness probe. This is for detecting whether the application process has crashed/deadlocked. If a liveness probe fails, Kubernetes will stop the pod, and create a new one.
- Readiness probe. This is for detecting whether the application is ready to handle requests. If a readiness probe fails, Kubernetes will leave the pod running, but won't send any requests to the pod.
- Startup probe. This is used when the container starts up, to indicate that it's ready. Once the startup probe succeeds, Kubernetes switches to using the liveness probe to determine if the application is alive.
So instead of adding just one healthcheck endpoint to your ASP.NET Core application, I would recommend to configure at least the startup and liveness probes where I would setup the liveness probe to be a ‘dumb’ probe and the startup probe to be a ‘smart’ probe.