One of the ways to monitor your IIS traffic is through ‘Failed Request Tracing’. This feature allows you to trace the full request pipeline and capture all the details.
Failed-request tracing is designed to buffer the trace events for a request and only flush them to disk if the request "fails," where you provide the definition of "failure". If you want to know why you're getting 404.2 error messages or requests start hanging, failed-request tracing is the way to go.
Installing Failed Request Tracing
Failed Request Tracing is not available out of the box in IIS but could be installed as a part of the ARR(Application Request Routing) feature. ARR can be installed directly from here or through the Web Platform installer when available in IIS.

After the installation is completed, the Failed Request Tracing feature becomes available in IIS. But before you can use it, you need to enable it.
If Failed Request Tracing is still not available after installing ARR, you can try to enable the Tracing feature by going to Start -> Turn Windows features on or off -> Internet Information Services -> Health and Diagnostics.

Configuring Failed Request Tracing
Let’s first walk through the steps to enable Failed Request Tracing:
- Open IIS Manager
-
In the Connections pane, expand the machine name, expand Sites, and then click Default Web Site.

-
In the Actions pane, under Configure, click Failed Request Tracing.

-
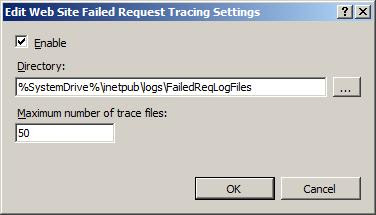
In the Edit Web Site Failed Request Tracing Settings dialog box, configure the following:
-
Select the Enable check box.
-
You can change the maximum number of trace files if you want to keep more than 50 requests
-
-
Click OK.
Now we need to configure a failure definition. A failure definition allows us to specify to conditions when a request should be traced.
-
In the Connections pane, expand the machine name, expand Sites, and then click Default Web Site(or the site that you want to have requests traced).
-
Double-click Failed Request Tracing Rules.

- In the Actions pane, click Add.

-
In the Add Failed Request Tracing Rule wizard, on the Specify Content to Trace page, select All content (*). Click Next.

- On the Define Trace Conditions page, select the Status code(s) check box and enter the status codes you want to to trace.

-
Click Next.
-
On the Select Trace Providers page, under Providers, keep all check boxes selected. Don’t change the other values.

- Click Finish.
View the Failed Request messages
-
To view the failed request messages browse to
%systemdrive%\inetpub\logs\FailedReqLogFiles\W3SVC1 (or the location that you configured). - Double click on a log file in the folder. For every request a new log file is created. Thanks to the available XSLT, the log file is presented in a digestable format:
