SQL Server Profiler is depecrated

The SQL Server Profiler has been around for a very long time. It is very useful if you are trying to see in real time what SQL queries are being executed against your database. However, in the SQL Server 2016, Microsoft announced that the SQL Profiler will be deprecated in future versions.

Does this mean that there are no profiling options left in SQL Server? Luckily no, the SQL Profiler will be replaced by Extended Events(XE). Extended Events works via Event Tracing (ETW) which consumes less resources and allows much more flexibility. It also can monitor more events than the Profiler.

Where can I find these Extended Events?

  • Open SQL Server Management Studio( for SQL 2014 or higher) and connect to one of your Database instances
  • Go to Management>Extended Events:

image

  • Expand the Extended Events section, right click on Sessions and choose New Session Wizard

image

  • The Session wizard will help us to select the events we want to profile. Click on Next >

image

  • Specify a session name and click Next >

image

  • Now you can choose an existing template. Leave the Do not use a template radiobutton checked and click on Next >

image

  • The next screen is where the real work is done. Here you specify the events you want to monitor. Luckily you can search through them. Select some events you want to track and click Next >

image

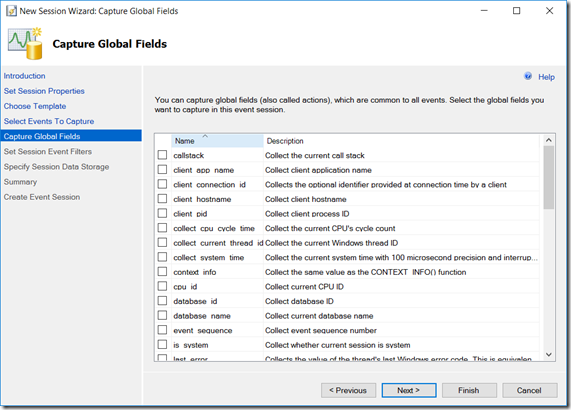
  • Now you can specify any global fields(e.g. username, database name,…) you want to capture together with the events. Click Next > to continue

image

  • Next step is to apply some optional filters to limit the amount of data that is returned. Click Next > to continue

image

  • The session storage allows you to specify how to collect the data and store it.  Click Next >.

image

  • On the Summary you get an overview of the selected options. Click Finish to generate the Session.
    • Note: There is an option to generate a script from this configuration. So you can re-use it later.

image

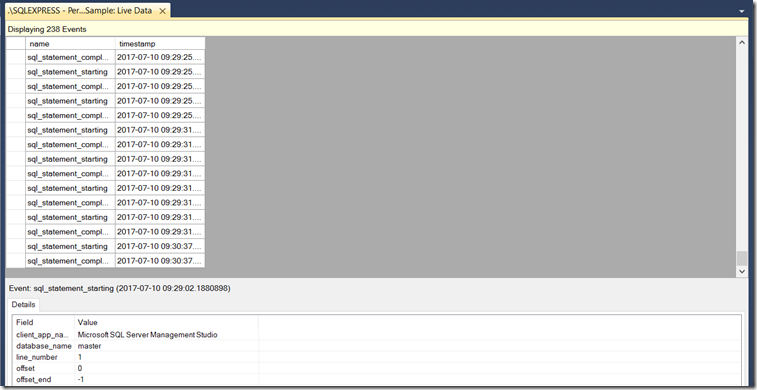
  • After clicking Finish you end up on a Success page. Here you can start the session immediately and watch the data when it is captured.

image

Popular posts from this blog

Azure DevOps/ GitHub emoji

I’m really bad at remembering emoji’s. So here is cheat sheet with all emoji’s that can be used in tools that support the github emoji markdown markup: All credits go to rcaviers who created this list.

Kubernetes–Limit your environmental impact

Reducing the carbon footprint and CO2 emission of our (cloud) workloads, is a responsibility of all of us. If you are running a Kubernetes cluster, have a look at Kube-Green . kube-green is a simple Kubernetes operator that automatically shuts down (some of) your pods when you don't need them. A single pod produces about 11 Kg CO2eq per year( here the calculation). Reason enough to give it a try! Installing kube-green in your cluster The easiest way to install the operator in your cluster is through kubectl. We first need to install a cert-manager: kubectl apply -f https://github.com/cert-manager/cert-manager/releases/download/v1.14.5/cert-manager.yaml Remark: Wait a minute before you continue as it can take some time before the cert-manager is up & running inside your cluster. Now we can install the kube-green operator: kubectl apply -f https://github.com/kube-green/kube-green/releases/latest/download/kube-green.yaml Now in the namespace where we want t...

Podman– Command execution failed with exit code 125

After updating WSL on one of the developer machines, Podman failed to work. When we took a look through Podman Desktop, we noticed that Podman had stopped running and returned the following error message: Error: Command execution failed with exit code 125 Here are the steps we tried to fix the issue: We started by running podman info to get some extra details on what could be wrong: >podman info OS: windows/amd64 provider: wsl version: 5.3.1 Cannot connect to Podman. Please verify your connection to the Linux system using `podman system connection list`, or try `podman machine init` and `podman machine start` to manage a new Linux VM Error: unable to connect to Podman socket: failed to connect: dial tcp 127.0.0.1:2655: connectex: No connection could be made because the target machine actively refused it. That makes sense as the podman VM was not running. Let’s check the VM: >podman machine list NAME         ...