Team Foundation Server 2012 Health monitoring

In previous versions of TFS, I used some Administrative reports to monitor the health of TFS. In TFS 2012, some reporting is built-in, although well hidden inside the TFS Web Access.

To access this information browse to the following URL: http://{servername}/tfs/_oi/. This will open up the TFS Control Panel with 2 tabs:

  • Activity Log: Shows you a list of recent actions
  • Job monitoring: Allows you track all TFS jobs, their execution time and the current job queue

image

Activity Log

The Activity log can be filtered by Team Project Collection and user. Results can be exported to CSV for further processing.

image

Job Monitoring

The Job Monitoring is further split into 3 sections:

  • Job Summary
  • Job Queue
  • Job History

The Job Summary contains the following reports:

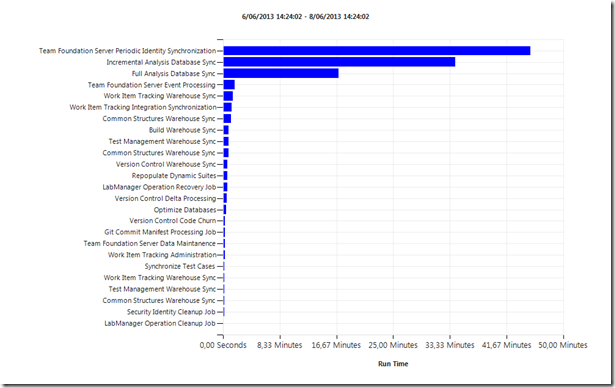
  • Total Run Time For Each Job: displays total amount of run time a particular job has taken over the time period.

TotalRunTimeForEachJob

  • Results Count: displays the number of different result types over the time period.

ResultsCount

  • Number Of Jobs Run: displays the number of times a job has run combined with the number of result types for that particular job.

NumberOfJobsRun

The Job Queue contains the following reports:

  • Job Queue Types: describes the job queue; it provides the counts for each queue type.

JobQueueTypes

  • Job Queue Details:  list of job queue entries for the specific type.

The Job History contains the following reports:

  • Average Run and Queue Time With Total Number of Jobs: combines the average queue time and run time for jobs; you can also view how many jobs were run at each hour.

AverageRunAndQueueTime

  • Job History: shows the job history results over the stated period of time (up to 500 entries).

image

Popular posts from this blog

Azure DevOps/ GitHub emoji

I’m really bad at remembering emoji’s. So here is cheat sheet with all emoji’s that can be used in tools that support the github emoji markdown markup: All credits go to rcaviers who created this list.

Kubernetes–Limit your environmental impact

Reducing the carbon footprint and CO2 emission of our (cloud) workloads, is a responsibility of all of us. If you are running a Kubernetes cluster, have a look at Kube-Green . kube-green is a simple Kubernetes operator that automatically shuts down (some of) your pods when you don't need them. A single pod produces about 11 Kg CO2eq per year( here the calculation). Reason enough to give it a try! Installing kube-green in your cluster The easiest way to install the operator in your cluster is through kubectl. We first need to install a cert-manager: kubectl apply -f https://github.com/cert-manager/cert-manager/releases/download/v1.14.5/cert-manager.yaml Remark: Wait a minute before you continue as it can take some time before the cert-manager is up & running inside your cluster. Now we can install the kube-green operator: kubectl apply -f https://github.com/kube-green/kube-green/releases/latest/download/kube-green.yaml Now in the namespace where we want t...

Podman– Command execution failed with exit code 125

After updating WSL on one of the developer machines, Podman failed to work. When we took a look through Podman Desktop, we noticed that Podman had stopped running and returned the following error message: Error: Command execution failed with exit code 125 Here are the steps we tried to fix the issue: We started by running podman info to get some extra details on what could be wrong: >podman info OS: windows/amd64 provider: wsl version: 5.3.1 Cannot connect to Podman. Please verify your connection to the Linux system using `podman system connection list`, or try `podman machine init` and `podman machine start` to manage a new Linux VM Error: unable to connect to Podman socket: failed to connect: dial tcp 127.0.0.1:2655: connectex: No connection could be made because the target machine actively refused it. That makes sense as the podman VM was not running. Let’s check the VM: >podman machine list NAME         ...