
Azure DevOps–Run GraphQL Inspector as part of your build pipeline

I introduced GraphQL Inspector in a previous blog post. Let’s see today how you can integrate it into your Azure DevOps pipeline.

You can do this by adding a command line task that invokes NPX. NPX stands for Node Package Execute and it comes with NPM. It is an npm package runner that can execute any package that you want from the npm registry.

I added a command line task to invoke npx:

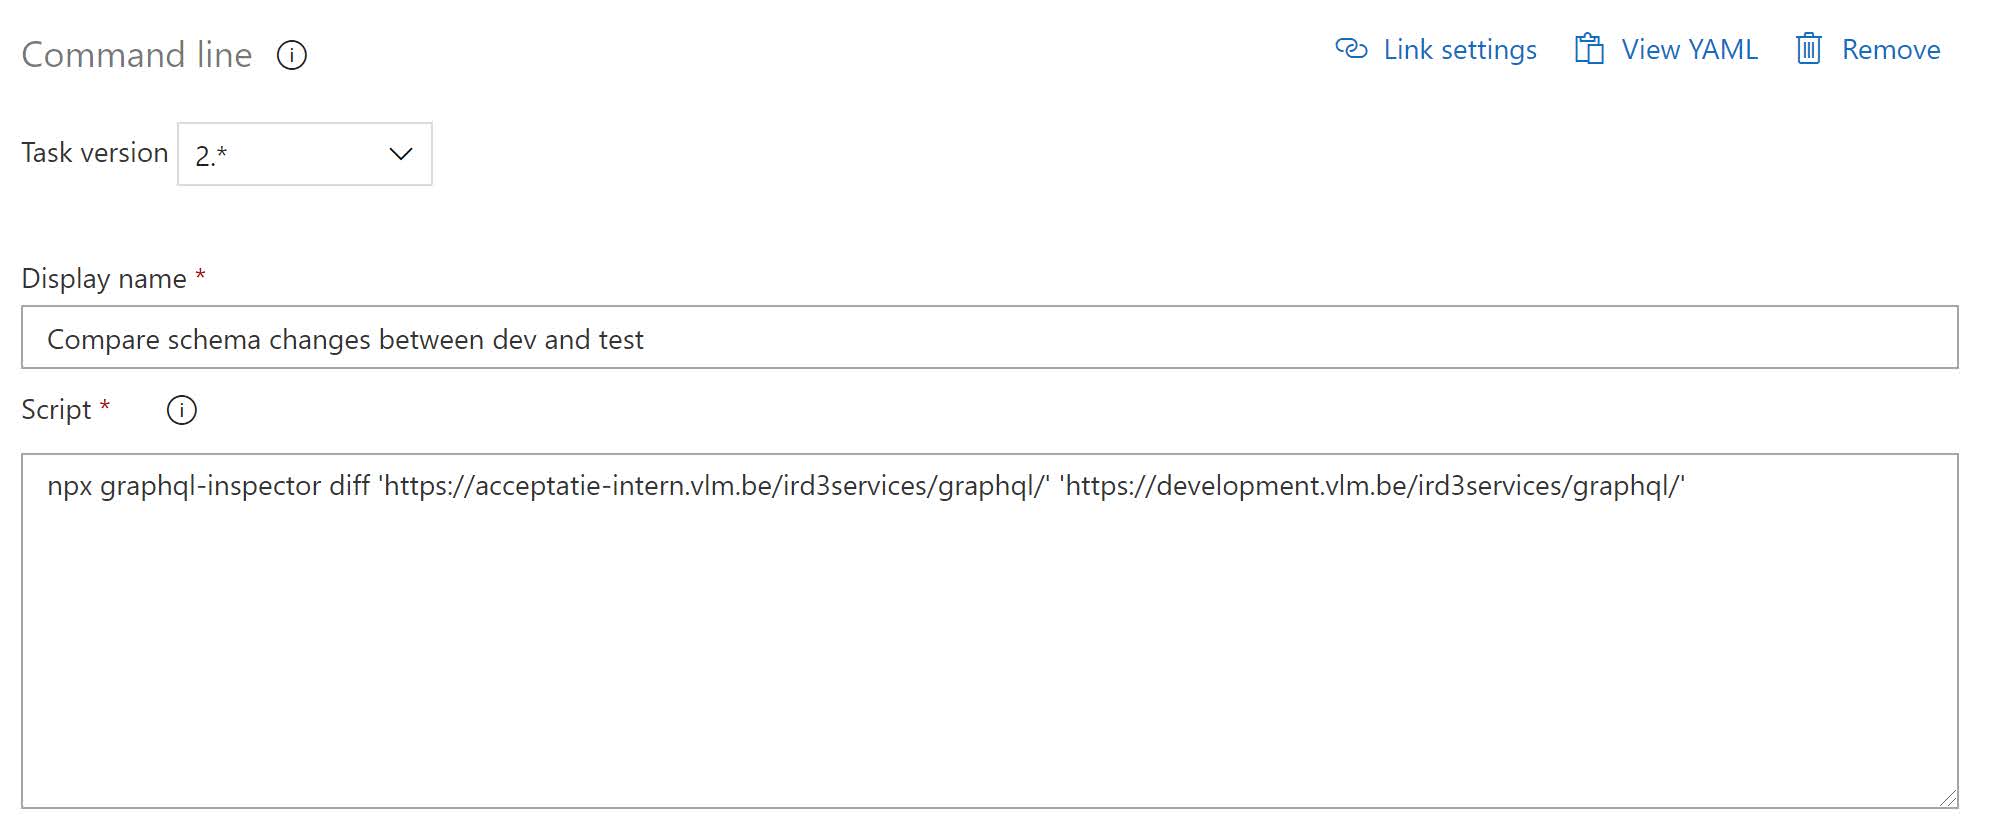
Remark: I blogged about NPX before(using GraphQL Inspector as an example).

Something you should really be aware of is the order of the parameters when invoking graphql-inspector. The first parameter should be the existing schema and the second parameter should be the new, updated schema.

Today I accidently switched them around which of course broke the backwards compatibility.

Here is the build output when using the wrong argument order:

And here is the build output after fixing the order:

Popular posts from this blog

Podman– Command execution failed with exit code 125

After updating WSL on one of the developer machines, Podman failed to work. When we took a look through Podman Desktop, we noticed that Podman had stopped running and returned the following error message: Error: Command execution failed with exit code 125 Here are the steps we tried to fix the issue: We started by running podman info to get some extra details on what could be wrong: >podman info OS: windows/amd64 provider: wsl version: 5.3.1 Cannot connect to Podman. Please verify your connection to the Linux system using `podman system connection list`, or try `podman machine init` and `podman machine start` to manage a new Linux VM Error: unable to connect to Podman socket: failed to connect: dial tcp 127.0.0.1:2655: connectex: No connection could be made because the target machine actively refused it. That makes sense as the podman VM was not running. Let’s check the VM: >podman machine list NAME         ...

Azure DevOps/ GitHub emoji

I’m really bad at remembering emoji’s. So here is cheat sheet with all emoji’s that can be used in tools that support the github emoji markdown markup: All credits go to rcaviers who created this list.

VS Code Planning mode

After the introduction of Plan mode in Visual Studio , it now also found its way into VS Code. Planning mode, or as I like to call it 'Hannibal mode', extends GitHub Copilot's Agent Mode capabilities to handle larger, multi-step coding tasks with a structured approach. Instead of jumping straight into code generation, Planning mode creates a detailed execution plan. If you want more details, have a look at my previous post . Putting plan mode into action VS Code takes a different approach compared to Visual Studio when using plan mode. Instead of a configuration setting that you can activate but have limited control over, planning is available as a separate chat mode/agent: I like this approach better than how Visual Studio does it as you have explicit control when plan mode is activated. Instead of immediately diving into execution, the plan agent creates a plan and asks some follow up questions: You can further edit the plan by clicking on ‘Open in Editor’: ...